September 2, 2023
Folks, we need to talk. I’m shut up in the house again, windows tightly closed, air-filters running, because the outside air quality is absolutely terrible. It’s “wildfire season”. Meanwhile, a neighbour is burning leaves in their back yard, apparently oblivious to the smouldering garbage smell already permeating the block. With all the recent concerns about air quality due to wildfires, you’d think that there’d be tonnes of accessible and immediate information to access to help us navigate things! Instead, it really feels like we’re on our own.
It seems so strange to me that this isn’t a bigger topic of conversation, especially considering how many people have been displaced by wildfires lately – nearly 70% of the population of the Northwest Territories, and many others in places around the world. Compared to potentially losing one’s home, air quality concerns can seem prosaic, even a bit insensitive, but this isn’t an either/or scenario. Wildfires don’t respect man-made borders, and we are all vulnerable to them in various ways.
Here in Alberta, like a lot of places, we’ve been dealing with “wildfire season” for a while now, but for me at least, the confusing information about related pollutants exposure didn’t really click until this year, in great part to what I learned since COVID-19. I’m going to share the research I’ve done, and the things I’ve learned over the past few months as I scramble to keep my family as safe as possible in a scenario where 10 million hectres of land has already burned in Canada this year. It’s a lot, so feel free to bounce around and just read the bits that help you in your situation.
The Problem With Particulate Matter
One thing I began to learn about during the period of time when we realized COVID-19 is airborne, is the importance of knowing about the size of droplets or particulate matter. This will impact what kind of filtration you use to keep those droplets or particulate matter out of your lungs.
The main concern we are having with the wildfires are PM 2.5 and PM 10. Respectively these are particulate matter 2.5 microns in size, (thirty times smaller than the diameter of a human hair) and PM 10, particulate matter 10 microns in size. Inhaling these particles can result in a wide range of very serious health outcomes, and even healthy people should be limiting exposure. They get into your lungs, (an obvious issue), but they also get into your bloodstream, mess with your organs in less obvious ways, and generally cause havoc.
The concentration of particulate matter is measured in micrograms (one-millionth of a gram) per cubic metre of air (μg/m3). The WHO (World Health Organization) recommends that a person not be exposed to more than an average of 5 μg/m3 of PM 2.5, and 15 μg/m3 of PM 10 over a year. The recommendations also state that a person should not be exposed to more than 15 μg/m3 of PM 2.5, and 45 μg/m3 of PM 10 in a day, and only for a max of 3 – 4 days in a year. We are absolutely blowing through these guidelines.
To help put this into perspective, 24 hours of exposure to PM 2.5 of 22 μg/m3 is roughly equivalent to smoking one cigarette. Even a non-smoking adult might not get too concerned about that, but it’s doubtful anyone would be okay with young children experiencing that level of exposure – which they are.
Edmonton hit PM 2.5 levels of over 400 about a month or so ago – 24 hours of that was equivalent to smoking over 18 cigarettes, with the associated long-term health damage! We’ve been averaging PM 2.5 and PM 10 levels of between 25 – 40 on “good days” since May. Cumulatively, this is having a serious impact on everyone’s health, especially those receiving the most long-term exposure such as the unhoused, and people with no filtration systems in their homes, as well as folks who are already more vulnerable to these kinds of pollutants (people with asthma and other respiratory diseases, the very young and old, and pregnant people).
Here’s a link to a handy-dandy little PM 2.5 to cigarette calculator you can use to do some calculations of your own, if you’re interested.
Keeping Safe in the Open Air
N95 masks are meant to filter out 95% of particles that are 0.3 microns in diameter or larger. K94 masks are meant to filter out 94% of particles of the same size. So these will absolutely help filter out PM 2.5 and PM 10 (which are 2.5 and 10 microns in size).
The average surgical mask is only 42% – 88% effective at filtering particles 0.3 in size. Compare that to cloth masks (16% – 23% for 0.3 filtration) and a bandana (9%). These options are still better than breathing unfiltered air.
However, these ratings are all based on a perfect fit, and very few of us are able to achieve that. When PM levels are high, it’s very important to limit how long you are exposed, and what level of activity you are engaged in. That is why all the scales used to measure air quality also come with health recommendations – including not engaging in strenuous activity when air quality is worse (because you breath in more).
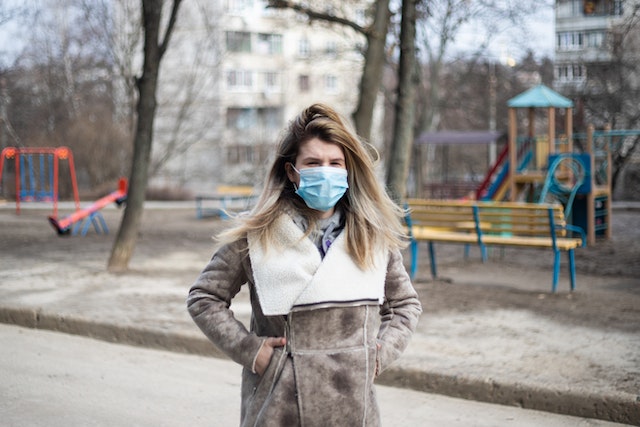
Checking the PM levels in your area before heading out can help you make informed choices about what level of filtration is best for your activity, and the amount of time you need to be outside. Raw-dogging bad air with no mask is your choice – but it WILL impact your health, so make sure you understand the risks, and consider taking extra precautions when it comes to children. If you happen to live in Alberta, some folks are going to yell at you about not needing to wear a mask outside, because COVID denial is big, and we haven’t shifted yet to understanding that this is a safety precaution for air pollution – but you’re probably already used to that sort of thing.
Keeping the Air Safe in Your Home
I’ll get to some more measurement info in a bit – but first, let’s get the air as safe as possible in your house!
On a bad smoke day, you want to close all your windows and minimize your exposure to the outside air. Yes, even when it’s sweltering and you have no AC. Then you want to filter the inside air.
If You Have Access to the Furnace
If you live in a house, and have access to the furnace, you can massively improve your inside air quality by using a good air filter. When Edmonton hit PM 2.5 levels over 400, we had two large HEPA filters (I’ll get to those in a bit) running and still couldn’t get the PM 2.5 levels down below 60 in the house. That’s better than 400, but still very bad. We were running a MERV 8 filter in our furnace, with the heat off, just circulating air. A fantastic person dropped off a MERV 13 filter and within 5 minutes of blowing air through that, PM 2.5 dropped to below 8.
What this little experiment proved to us is that the furnace filter is very important. Filtration solutions are expensive – so if you are pinched for money, a furnace filter can be your best option overall. But if you aren’t used to shopping for furnace filters, the different rating systems used can be confusing. When that wonderful person went to Home Depot and picked us up a filter, all the MERV 13 filters were sold out, and all that was left were a stack of 3M filters. Folks didn’t realize that there are more rating systems than MERV, so they weren’t buying them. To help you avoid this issue, here is a rough comparison of the three main rating systems.
Most homes use a MERV 8 filter as their standard, and you should be changing your filter once a month because they get dirty and won’t keep filtering the air. To combat wildfire smoke, you need something that will filter the most amount of smaller particles.
In addition to cost, and rating, it’s important to consider the age and efficiency of your furnace. Older, less energy-efficient furnaces actually tend to handle higher rated filters better than newer, energy-efficient furnaces. Some people call MERV 13s the furnace-killers, because energy-efficient models struggle to draw air through them, so you should check your model and see what is recommended. Our 24 year-old furnace is a beast, and it seems to have no trouble running a MERV 13 and its equivalent, the 3M brand 2200.
From anecdotes I’ve gathered, many people find that the MPR and FPR filters also strain furnaces less than MERV filters, just because of the different design.
HEPA Filter Air Purifiers
HEPA filters (high-efficiency particulate air filter) can be found on all sorts of air purifiers available on the market. They capture pollen, dust, dirt, and particulate matter around 0.3 microns in size. They help with many viruses and they definitely help with wildfire smoke. Don’t even bother with air purifiers that aren’t using HEPA filters.
HEPA filters come with specs such as how many square feet can be covered by the unit, so factor that in and make sure you get enough units to cover your entire house if you are looking for broad filtration inside. Filter replacements themselves can be costly. Luckily, using a (usually carbon-activated) prefilter can extend the life of your HEPA filter, and even with heavy use you shouldn’t have to replace it for 6 – 8 months for most models, with some suggesting once a year. There are a lot of tips out there for taking care of your HEPA filters if you are really worried about cost, such as sealing them in airtight plastic bags when not in use.
When the air quality is really bad, it’s hard to find a HEPA filter for a decent price, so don’t wait for emergency conditions to get one! A surprisingly common mistake folks also make is not knowing they have to remove the plastic the filter will come packed in, so make sure you do that before running your machine. Then plug it in, and go!
If you can’t afford to have a filter running in every room, consider creating a “clean room” on the worst days, and having your most vulnerable there until air conditions improve – that includes pets.
DIY Filtration
A lot of folks were sharing great do-it-yourself filtration information to help mitigate the spread of COVID in the home when someone was sick. These Corsi-Rosenthal boxes are also an excellent mitigation strategy for wildfire smoke. Using a box fan, you outfit it with as many air filters as you can afford – and remember that the higher filtration rating you go, the better. I’ve provided a link to a how-to, but just searching Corsi-Rosenthal boxes will get you a tonne of great info. It’s lower cost than HEPA air purifiers and also really helps if you don’t have access to a furnace. The range of these devices is not going to be very large, so it is suggested that you create a “clean” room, as I’ve mentioned before. You choose a room in your home where you’ll feel comfortable, and can have your pets and/or other vulnerable folks in, close up all the windows and doors to it, and run your Corsi-Rosenthal box filter.
Measuring The Risk: Air Quality Ratings
In order to make informed decisions about air quality, you need to know is what to be worried about, and how that information is communicated. Just like we had to learn about UV ratings, air quality ratings are increasingly common, but they can be confusing! There are a number of different rating systems out there, so here’s a quick run-down of what they measure and how they work. Each scale listed includes a link to more information about that system. Pollutants are measured in micrograms (one-millionth of a gram) per cubic metre of air (μg/m3).
CAQIDAQICAI
etc.
Common Air Quality Index (used in the European Union)
Daily Air Quality Index (used in the United Kingdom)
Comprehensive Air Quality Index (South Korea)
* PM 2.5, PM 10* O3 (ozone at ground level)* NO2 (nitrogen dioxide)*SO2 (sulfur dioxide) CO (carbon monoxide)CAQI: 0 – 100, higher the number, worse the air quality, colour code green (good) to red (bad)
DAQI: 1 – 10, uses colour code from green (good) to purple (bad)
CAI: 0 – 500 uses colour code from blue (good) to red (bad)
Risk and Recommendations
In Canada, you can check the AQHI (Air Quality Health Index) by city, just like you check the temperature, forecast, and UV index. For example, I check this government site each morning for Edmonton. The first thing you see is the colour-coded scale like below, and where your city is on it.
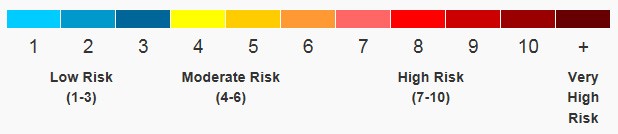
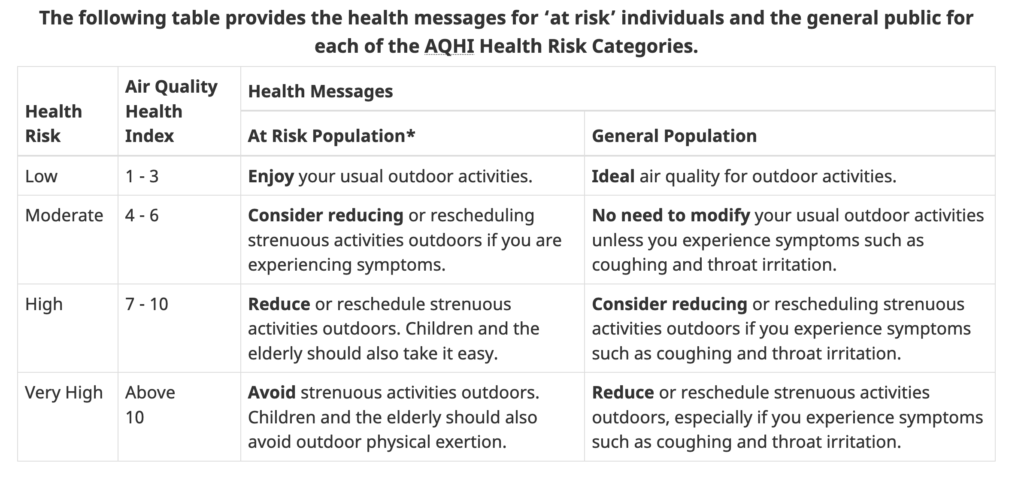
Along with the four categories of low risk, moderate risk, high risk, and very high risk, there are recommendations about what level of activities you should engage in depending on whether you are in an at-risk population, or in the general population. But these are only guidelines, and it’s really important to pay attention to your own individual sensitivities. A 3 on the AQHI is considered low risk, but it might be enough to set off someone’s asthma for example.
Understanding all the Information: What’s the Source?
While the AQHI is a useful tool, it does lack some specificity. For example, it doesn’t tell you what the particulate matter levels are at any given time. There are other resources for that, such as aqicn.org, an Air Quality Index website. To illustrate why this matters, as I write this bit, Edmonton is at a 3 on the AQHI, which is in the low risk category. But the AQI website tells me that the readings from the Woodcroft monitoring station are 82 on the AQI scale, and it provides a breakdown of the specific pollutants: PM 2.5 levels are 82 μg/m3. That is not good. Once again, 24 hours of exposure to PM 2.5 levels of 22 μg/m3is roughly equivalent to smoking a cigarette. Since the concern is cumulative impacts, we need to take a cumulative approach to exposure.
There are lots of different apps on the market that can report the air quality to you, using a variety of scales like those explored above. But where are they getting this information from?
I installed 3 apps when things were bad, trying to get a handle on the situation: IQAir Air Visual, AQI (Air Quality Index by Purelogic Labs), and the Plume Labs: Air Quality app. They all gave me wildly different information and use AQI instead of AQHI. Here is what these 3 apps are telling me, right now, about the air quality where I am, and what level the app considers this AQI:
You can see why this conflicting information could be unhelpful! None of these readings match the PM 2.5 readings from the Woodcroft monitoring station either, so what am I actually dealing with in terms of air quality? Also, why is 52 AQI considered high pollution by one app and 58 is moderate on another? Even more confusingly, the reading in the AQI by Purelogic Labs app changed drastically when I went to the settings and switched from AQI standard (India) to AQI US. From 29 AQI to 61 AQI!!
I started to look into where these apps (and the websites) get their information from to understand the information better.
IQ Air Visual is interesting because it has a map showing where wildfires are currently burning, as well as a host of air quality readings around your location. You can access this map through the app or their website. The company also sells a variety of air monitors and purifiers. After some digging, I was able to find out that they use a mixture of data sources: continuous monitoring stations, passive and particulate monitors, and reporting from individuals who have their air monitor devices. The big problem with that last one is that we have no idea if those personal readings are being taken from inside a filtered house, or outside where the air is worst.
Alberta, like many provinces and territories, have a number of continuous, year-round air monitoring stations. In Alberta, these are “managed and operated by community-based, not-for-profit, multi-stakeholder groups.” So for example, Edmonton has 4 of these stations: Woodcroft, Edmonton East, Edmonton McCauley, and Edmonton Lendrum. The station closest to my home is 5 km away though, and air quality can vary greatly over 5 km!
There are also passive monitors that are set up by these community-based orgs, as well as particulate monitors (called PurpleAir monitors) that may be closer to where you actually are, giving you different readings. Many apps also use satellite imaging to detect pollution levels. These apps all use individual reporting from consumers using their air monitors as well. Some will average out the results, which may explain why they can vary so drastically from what the continuous monitoring stations are reporting.
Depending on what sources your app draws upon, you can end up with the wildly different results that I did – which is not great for making a risk-based assessment. One source can tell you the air is perfectly fine, but your nose is telling you it’s absolutely not. More dangerous is when you don’t really have any indication of the severity of the pollutants, because it doesn’t reek like smoke, or look hazy, but things are actually quite terrible.
Adding a Monitor to your Toolbox
The often contradictory or unreliable information these apps were giving me really messed with my head. Was I over-reacting? Was I under-reacting? I didn’t feel like I had enough correct information to make informed decisions. So I did some research, and found an air monitor device that I liked, and I ordered it.
I’m not going to recommend any one kind of monitor – there are literally dozens on the market, and you can read customer reviews to your heart’s content to find the one that works best for you. But I can say, once I got my monitor and had it up and running, things changed. A lot.
I bought a portable monitor, so I can check the air outside, but also monitor it throughout the house to see whether the filters are working. I take it with me when we go on family trips, and it’s set with an alarm to let me know if we need to mask up. I don’t need to rely on stations that are many kilometres away, because I know what the air quality in my home is, right now. It’s been interesting taking the monitor into other spaces, like where I work, or where I shop. Some places have really excellent air filtration and that’s a huge relief – but let me just say, shopping malls don’t seem to be on that list so far – a concern for shoppers but also very much for retail workers! In big part I wonder if the recent trend to turning down the AC in those spaces, here in Edmonton anyway, is part of the problem.
Uncertain About the Future
I do have to say though, that ignorance is bliss. When I didn’t realize the risk to myself and my family, I wasn’t constantly worrying about the air quality. I’m not saying I want to go back to that – I’d much rather make sure my kids aren’t growing up with exposure to pollutants that are going to cause them long-term health problems! But it feels a bit surreal walking around outside on a bad air day, masked up, seeing others bare-faced, pushing their babies in strollers, walking their tiny dogs, just out for a stroll in air that is full of harmful particulate matter. I want to proselytize air monitoring to everyone, but I know it won’t be received well. A lot of folks just don’t want to know, and I get that. But it’s also a privilege. For those who are immunocompromised, disabled, and/or especially vulnerable to this kind of pollution (like those with asthma, COPD, long-COVID etc.) it’s not an option to ignore the risk. Once again, even if you think you can pay the debt this exposure creates in your body, you almost certainly have friends or loved ones who can’t.
I have also become a lot more aware of indoor pollution in the form of VOCs, volatile organic compounds. I’d heard before that levels of VOCs are much higher indoors than out, and that many people are exposed to dangerously high levels of these human-made chemicals unknowingly, in the form of off-gassing, cleaning products, and cooking – but having the levels measured along with particulate matter has been quite the eye-opener. Obviously some VOCs are more harmful than others, but having consistently high levels is bad, any way you look at it. Ironically, seeing VOC levels spike every time we cook indoors has highlighted just how badly we need to improve our indoor ventilation – at a time when we’re doing everything we can to shut things up to keep ourselves safe. On the really bad air days, we have found we cannot be cooking inside because we just cannot get the air flow we need to clear it out.
I’m not sure what we’re going to do long-term to deal with this problem – but hoping that wildfires will just stop being a thing is not a good strategy. A shut-up house gets stuffy and stinky fast, even worse than in our harsh winters when we at least still tend to have some descent ventilation going on. I find myself checking the monitor often just to find a few minutes in a day where the levels are bad, but not apocalyptic-bad, and then we all run around flinging windows and doors open and running fans just to air things out, until pollution levels creep up inside to a point where it’s no longer worth the risk. When Edmonton hit PM 2.5 levels over 400, and no matter what we did, the levels inside were still dangerous, we taped MERV 8 filters up over all the air intakes, and taped up around window casings. It helped a lot – but it also felt very dystopic. I kept questioning if we were just being paranoid and over-reacting, despite the fact that I had data proving that wasn’t the case.
Our furnace isn’t going to last many more years and we’ve been pondering an update – but this whole experience has changed our minds about a few things. For example, a super high-efficiency furnace may not be the way to go, if it can’t handle the filtration we need in these times. We need a system that can provide excellent ventilation while not compromising on filtration. In the mean-time, I guess we’re just going to keep looking like weirdos, masked up while biking groceries home, talking about the Air Quality Health Index to folks who have never heard of it before. I’m just hoping that for some of you, this is useful info that will help you make informed decisions about your own mitigation strategies.